
Event Chain Methodology
Monte Carlo Simulations
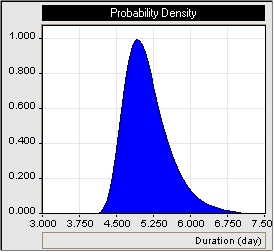
Once events and event chains are defined, quantitative analysis using Monte Carlo simulation can be performed to quantify the cumulative impact of the events. Probabilities and impacts of risks are using as in input data for Monte Carlo simulation of the project schedule. In most real life projects, it is necessary to supplement the information regarding the uncertainties expressed as an event with distributions related to duration, start time, cost, and other parameters, as performed in classic Monte Carlo simulations. If the original (baseline) project schedule is defined as a "best case scenario", continuous distributions skewed towards the beginning of the range may be used to represent small "fluctuations" in task parameters. Examples of these distributions can be Lognormal, Gumbel, Rayleigh, and Beta.
It is important to discriminate between the factors that are contributing to the "fluctuation" defined by the distribution and the results of events to avoid a double count of the same factors. For example, Disturbance Reduction System Testing is scheduled for between 10 to 11 months. This duration fluctuation will be caused by factors different from the risks explicitly defined for this activity.